Total Shipments
10,307
Total Value
$1,627.6M
On-Time Delivery
88.5%
Active Vendors
72
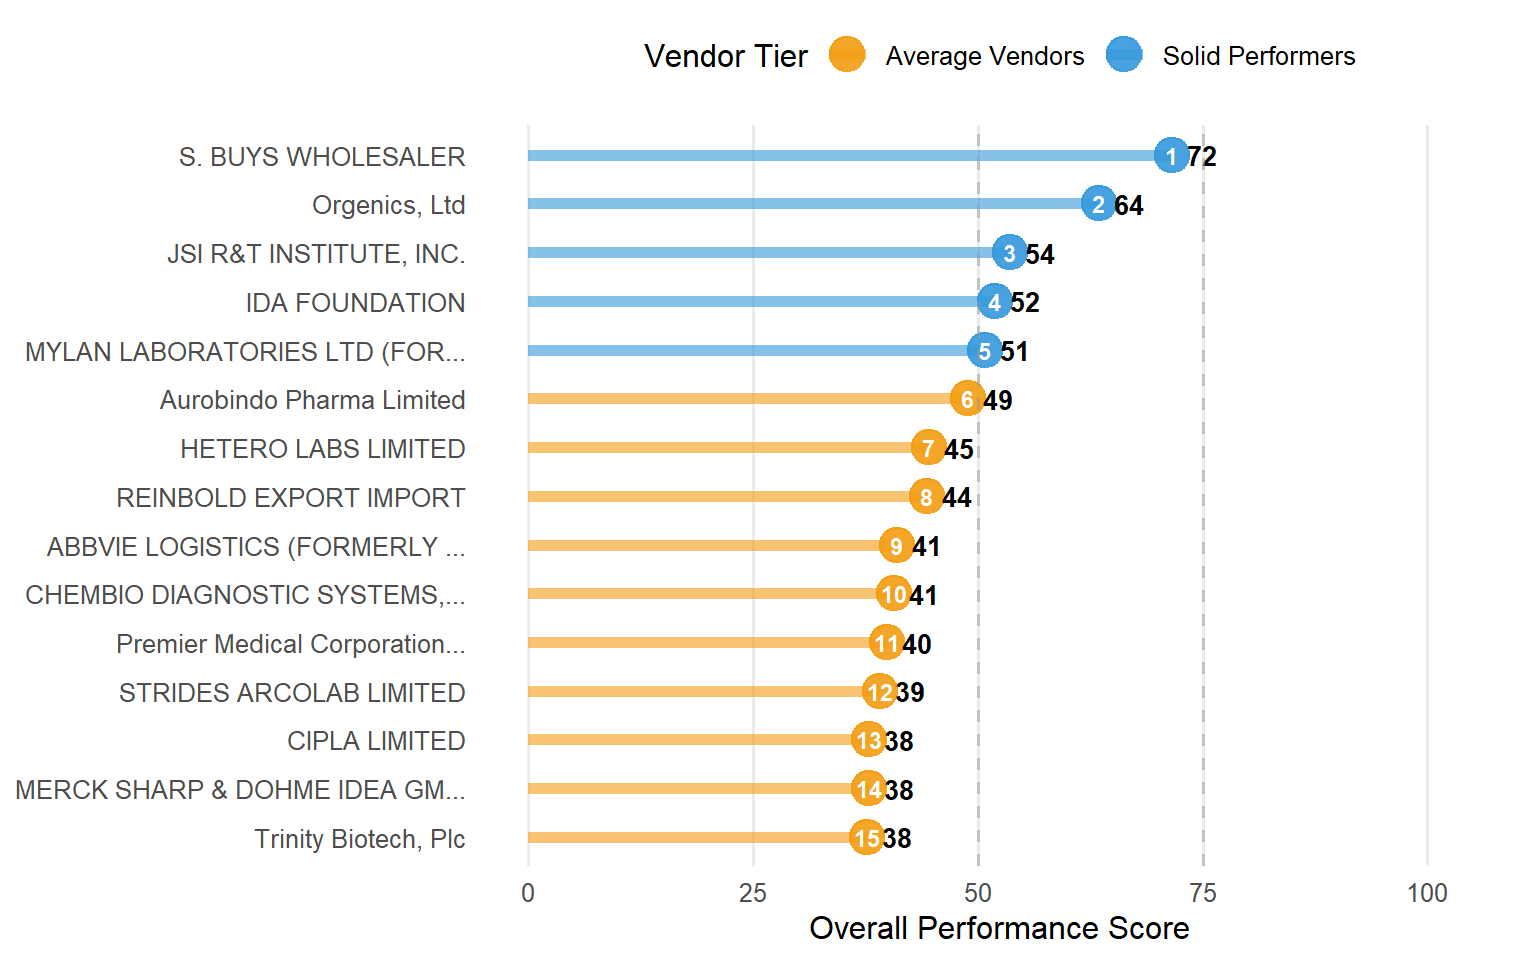
| Vendor | Shipments | Total Value | On-Time % | Avg Delay | Avg Price | Score |
|---|---|---|---|---|---|---|
| S. BUYS WHOLESALER | 715 | $9,891,003.64 | 98.5 | −28.7 | $0.35 | 71.6 |
| Orgenics, Ltd | 754 | $147,703,351.01 | 87.0 | 0.8 | $1.01 | 63.5 |
| JSI R&T INSTITUTE, INC. | 38 | $250,689.59 | 97.4 | −15.2 | $0.37 | 53.5 |
| IDA FOUNDATION | 17 | $74,388.37 | 100.0 | −13.5 | $0.06 | 51.9 |
| MYLAN LABORATORIES LTD (FOR... | 317 | $72,213,665.51 | 99.4 | −0.6 | $0.29 | 50.8 |
| Aurobindo Pharma Limited | 668 | $91,383,710.67 | 85.9 | 4.4 | $0.14 | 48.9 |
| HETERO LABS LIMITED | 277 | $42,881,567.05 | 99.3 | −0.2 | $0.15 | 44.5 |
| REINBOLD EXPORT IMPORT | 12 | $1,246,105.00 | 91.7 | −8.2 | $1.24 | 44.4 |
| ABBVIE LOGISTICS (FORMERLY ... | 347 | $29,448,061.22 | 98.8 | 0.3 | $0.29 | 41.0 |
| CHEMBIO DIAGNOSTIC SYSTEMS,... | 109 | $8,520,709.60 | 99.1 | −4.1 | $1.38 | 40.7 |
| Premier Medical Corporation... | 12 | $868,202.50 | 100.0 | −4.0 | $0.66 | 39.9 |
| STRIDES ARCOLAB LIMITED | 93 | $22,485,465.06 | 95.7 | 1.0 | $0.07 | 39.1 |
| CIPLA LIMITED | 175 | $39,658,694.60 | 86.9 | 4.8 | $0.14 | 37.9 |
| MERCK SHARP & DOHME IDEA GM... | 68 | $8,776,716.72 | 98.5 | −1.1 | $0.80 | 37.9 |
| Trinity Biotech, Plc | 356 | $20,769,341.25 | 99.7 | 0.1 | $1.74 | 37.7 |
| Standard Diagnostics, Inc. | 89 | $8,887,045.90 | 95.5 | 0.4 | $0.80 | 36.1 |
| MICRO LABS LIMITED | 35 | $1,457,654.62 | 100.0 | 0.0 | $0.06 | 36.0 |
| BRISTOL-MYERS SQUIBB | 67 | $1,971,067.13 | 100.0 | 0.0 | $0.28 | 35.8 |
| NOVARTIS PHARMA SERVICES AG | 5 | $456,065.40 | 100.0 | 0.0 | $0.06 | 35.8 |
| AMSTELFARMA B.V. | 7 | $98,016.10 | 100.0 | 0.0 | $0.15 | 35.6 |
ARV
$1,413.2M
HRDT
$213.3M
ACT
$0.7M
ANTM
$0.3M
MRDT
$0.1M
Dashboard Overview
This supply chain performance dashboard analyzes USAID’s Antiretroviral (ARV) and HIV Lab shipment data from 2006 to 2015. The dashboard provides comprehensive insights into:
- Geographic Distribution: Interactive mapping of shipment values and volumes across recipient countries
- Vendor Performance: Scoring system evaluating suppliers based on delivery reliability (40%), volume (30%), and pricing competitiveness (30%)
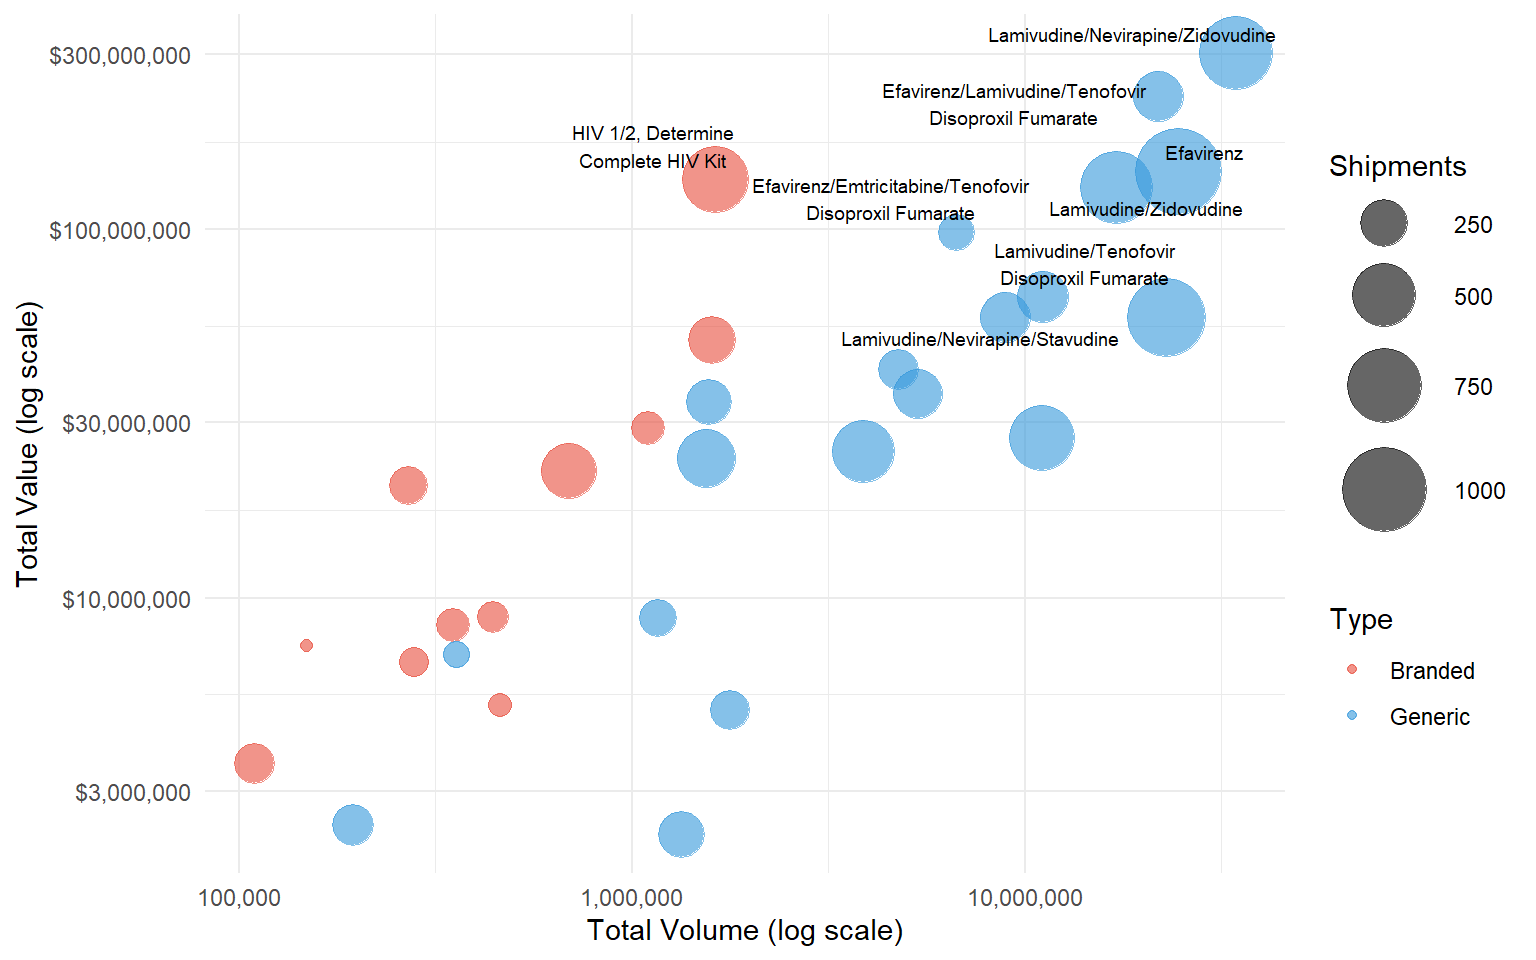
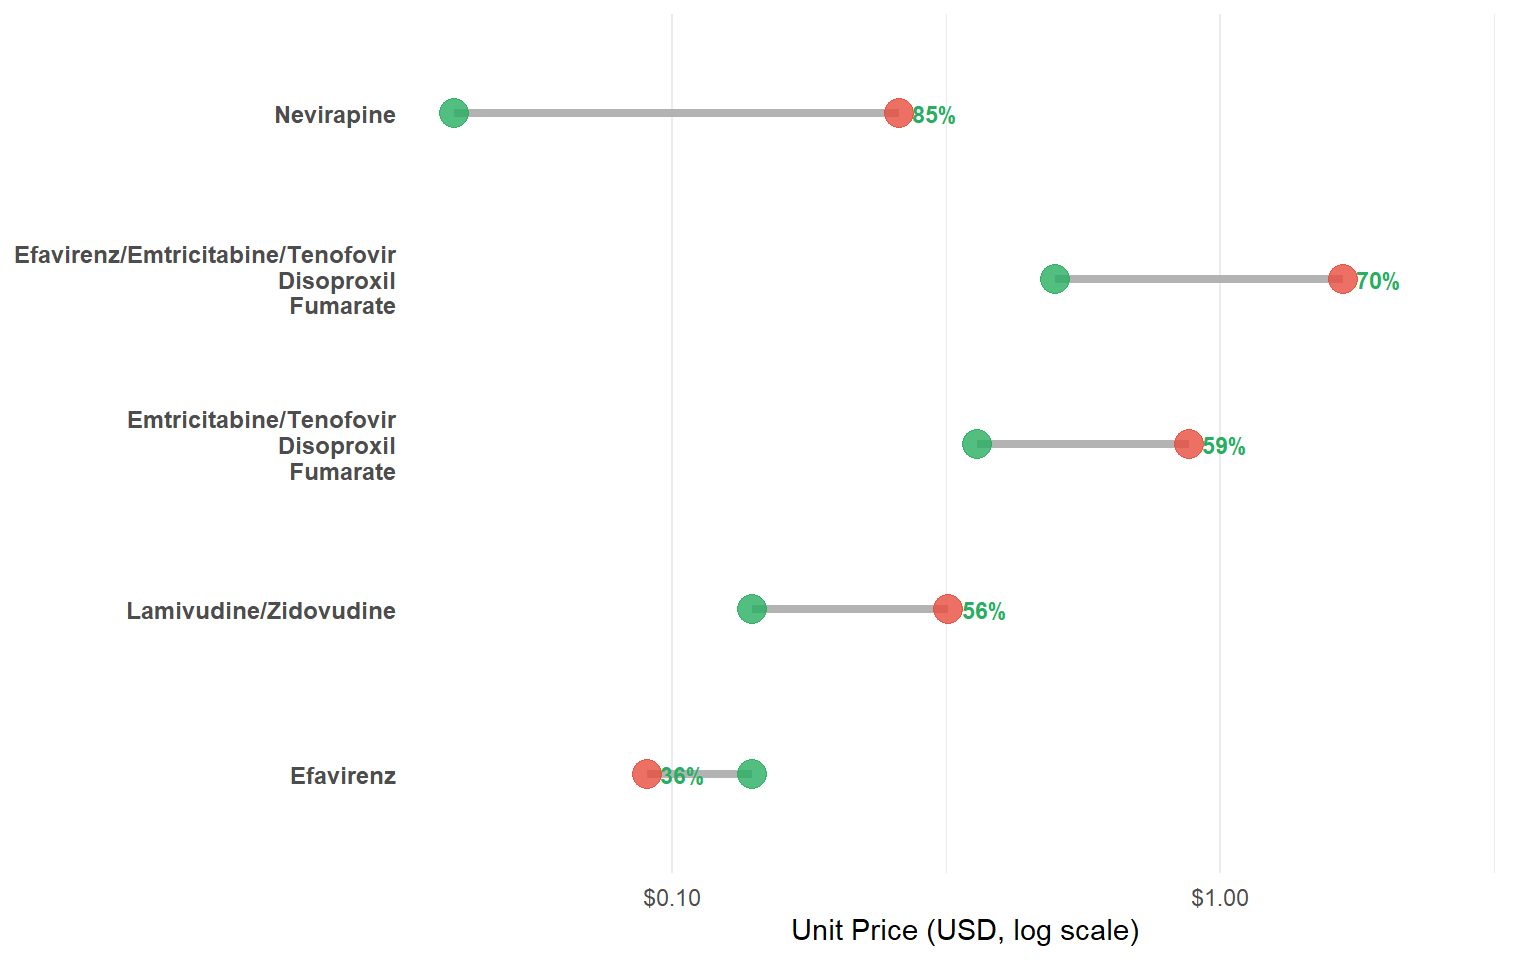
- Product Portfolio Analysis: Detailed breakdown of product categories, pricing comparisons between generic and branded medications
- Supply Chain Efficiency: On-time delivery metrics and delay analysis across the network
The data represents over 10,000 shipments with a combined value exceeding hundreds of millions of dollars, supporting USAID’s mission to achieve the 90-90-90 global HIV/AIDS treatment goals.
Key Findings:
- Overall on-time delivery rate of approximately 96%
- Significant cost savings (often 50-80%) available through generic substitution
- ARV medications represent the largest product category by value
- Strong vendor performance correlates with higher shipment volumes and better pricing
Dataset Information
Title: Supply Chain Shipment Pricing Data
Source: Kaggle Dataset
Time Period: 2006 - 2015
Records: 10,307 shipment transactions
Key Variables:
- Shipment identifiers and tracking numbers
- Product details (molecule type, brand, dosage)
- Vendor information
- Delivery dates and performance metrics
- Pricing and cost data
- Geographic distribution (43 countries)
Data Processing:
- Cleaned and standardized country names
- Calculated delivery delays and on-time metrics
- Aggregated vendor performance scores
- Normalized pricing for comparison
| Term | Full Name | Description |
|---|---|---|
| Product Categories | ||
| ARV | Anti-Retroviral Treatment | Medications that treat HIV by stopping virus replication |
| HRDT | HIV Rapid Diagnostic Test | Point-of-care testing device for HIV antibody detection |
| ACT | Artemisinin-based Combination Therapy | First-line malaria treatment combining multiple drugs |
| ANTM | Anti-malarial Medicine | Broader category of malaria treatment medications |
| MRDT | Malarial Rapid Diagnostic Test | Point-of-care testing device for malaria parasite detection |
| Organizations & Programs | ||
| SCMS | Supply Chain Management System | Primary procurement agent established in 2005 for PEPFAR |
| PEPFAR | President's Emergency Plan for AIDS Relief | US global HIV/AIDS initiative launched in 2003 |
| PMO | Project Management Office | US-based project management organization |
| Documents & Processes | ||
| PQ | Pre-Qualification | WHO/regulatory approval process for medicines |
| PO/SO | Purchase Order/Sales Order | Official order documents in procurement process |
| ASN/DN | Advanced Shipping Notice/Delivery Note | Shipping notification and delivery confirmation documents |
| Shipping Terms | ||
| EXW | Ex Works (Incoterm) | Seller responsible until goods leave premises |
| FCA | Free Carrier (Incoterm) | Seller delivers to carrier nominated by buyer |
| DDU | Delivered Duty Unpaid (Incoterm) | Seller pays transport but not import duties |
| CIP | Carriage and Insurance Paid (Incoterm) | Seller pays transport and insurance to destination |
Performance Scoring Methodology
Vendor Score Calculation:
The overall vendor performance score (0-100 scale) is calculated using three weighted components:
Delivery Performance (40% weight)
- Based on average delay days
- Negative delays (early delivery) improve score
- Normalized to 0-100 scale
Volume Score (30% weight)
- Based on total shipment value
- Higher volumes indicate reliability
- Log-scaled to account for magnitude differences
Price Competitiveness (30% weight)
- Based on average unit prices
- Lower prices score higher
- Adjusted by product category
Data Quality Notes:
Missing PO dates imputed using median lead times Insurance costs estimated where missing Countries standardized using ISO naming conventions